This week was the first week of Lesson 2 of our outreach workshop in Pacheco elementary school. This year we changed our lessons from the previous years by introducing a new robot, the scribbler robot. The Computer Engineering department here in Cal Poly was kind enough to let us borrow 10 of these robots to use during our 3rd and 4th week of outreach.
These robots have a GUI software were instructions can be dragged and placed and that makes the programming of these robots fairly simple. Using this software, we have implemented a lesson plan to show the students a little bit more about how programming works and allow them to tell the robot what to do.
The concept of programming can be abstract to some of the kids so we are trying to improve the lesson so the kids can wrap around the idea of following instructions one at a time and seeing how the robot can only execute one instruction at a time. The whole in the middle of the robot is a spot to place a marker so that the path can be tracked and compared to the instructions that were given to the robot.
The kids all really seemed to like being able to tell the robot what to do and seeing the end result in paper. Though some kids were at different levels when it came to designing different paths and shapes, all of the ICEX students that went to help did a great job of making sure that all the kids were engaged and were getting something out of the lesson.
The next lesson will consist of using binary encoder robots that are also the same ones we will be taking to Malta for the outreach there. I love seeing all the kids super excited about robots and I hope we are making a difference with these kids and the kids we will meet in Malta.
--
Cecilia
The International Computer Engineering Experience Program is an opportunity for Cal Poly and Harvey Mudd students to apply their technical knowledge in an international context and to increase global citizenship across campus.
Friday, February 8, 2013
Biological Sensor System
We've been working 'round the clock in preparation of our trip to Malta and Sicily! A lot of progress has been made recently. We have now purchased a sensor system from Onset, a US company based out of Cape Cod. We were originally considering another system, but the Onset solution saved us about $200. Another major perk of this system is that we are expecting to have it at Cal Poly in approximately 9 days; so we will have time to acquaint ourselves with the system prior to actually deploying it in Malta.
As I said before, we are expecting delivery of this system in approximately a week and a half. I'm very eager to begin testing the system and learning the interfaces. More updates to follow!
Above is a picture of the sensor. It measures temperature and conductivity, which is easily converted to salinity. Measurements can be taken in arbitrary intervals between 1 sec and 18 hrs, configurable through the base station (described below). The sensor is rated to withstand depths of up to 70m, which more than meets our needs, given that our tether is only 40m long. Conductivity measurements are reported with a resolution of 2 uS/cm3, providing a great amount of detail. Temperature data is reported with 0.01 degree Celsius resolution, giving great detail there, as well.
The data collected by the sensor is all stored internal, with sufficient memory to hold 18,500 temperature and conductivity measurements between dumps to the base station.
Pictured above is the USB base station required to interface the datalogger with a PC. The set of included adapters provides the option for adding capabilities in the future through the addition of more sensors and dataloggers.
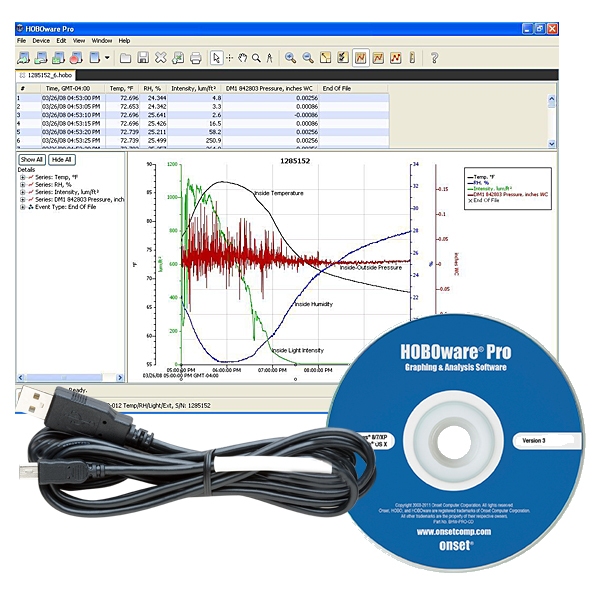
Once the datalogger is connected through the USB base station, the Onset software (pictured above) can be used to easily visualize, capture, and/or export the data. A variety of plots and graphs can be automatically generated in the software. Data can also be tabulated and exported as *.txt, *.xls, or *.csv files.
Monday, February 4, 2013
Timmy's visit to Mudd
Last week, after our exciting and productive weekend with the Cal Poly students at St. Luis Obisbo (which has been blogged about extensively already), Timmy made a visit Claremont and gave two talks. I attended both of his talks, and got two different perspectives of the Timmy's cool research in archaeology -- the first was more culturally and archaeologically slanted, geared towards students studying archaeology, whereas the second was geared towards the engineering students at Mudd. Both talks were fascinating, and the combination deepened my understanding of how engineering and archaeology can interact with one another.
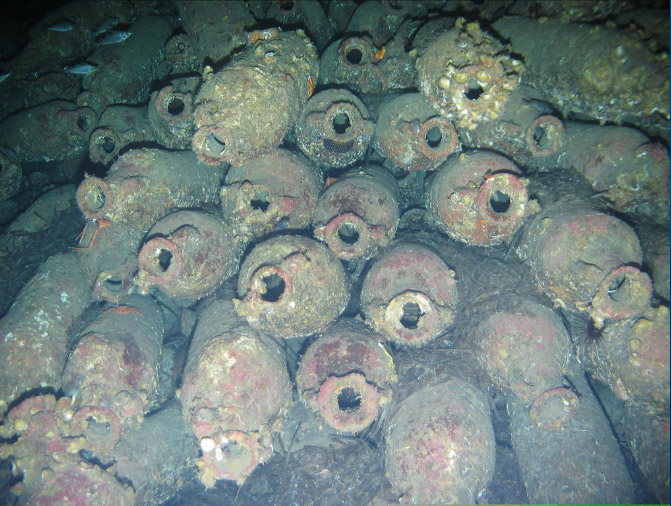
In Timmy's first talk at Pitzer, he talked about the history of shipwrecks in the 1st century AD, how ships spot land by orthographic clouds, how islands are used as waypoints. He explained the common findings in ancient shipwreck and what they show about the Roman empire. He emphasized how the Mediterranean islands, such as Malta, played a crucial part as a waypoint to transferring goods from Rome to the rest of the empire, or the vice versa. This makes Malta a great spot for archaeological exploration!
![]() |
| Amphorae, a common find in shipwrecks in the Mediterranean. ROV still by Aurora Trust. (http://www.machuproject.eu/img/ventotene01.jpg) |
The talk in Mudd was about how engineering (specifically side-scan sonar) can help him achieve his goals in archaeology. It tied together the aspects of engineering and archaeology. Timmy emphasized the importance for an archaeologist of being comfortable with technology. One point Timmy emphasized a lot is the importance of being mindful of the various different disciplines of academia (and even industry) that an archeologist must consider when excavating underwater sites. Marine biologists may be interested in the data about boulders, rare marine life, and the active ecological systems within historical remains; geologists may be interested in the collection of sediment, change in salinity of water or oxygenation levels; the military may be interested in the techniques of sonar scanning and the method of detecting, or instance, underwater mines.
![]() |
| Side-scan sonar of Amphorae by Aurora Trust. (http://www.flickr.com/photos/auroratrust/) |
Saturday, February 2, 2013
Science Data Visualizations!
This past weekend was the 'ICEX Workshop', the first meeting between the Cal Poly and Harvey Mudd ICEX groups. I won't talk too much about the various activities and events since my colleagues have already covered that pretty well. I really enjoyed the weekend, it was great to meet the HMC students and I think we have a good group dynamic. It was also a good experience to try a couple ROV deployments, since its hard to imagine all the many things that can possibly go wrong until they actually go wrong!
As I mentioned in my previous blog post, my main focus with ICEX this quarter is on visualizations of scientific data gathered by the ROV. In this context, "Scientific Data" refers to measurements of temperature, salinity, etc. taken at short intervals (ideally about once per second) during the deployment. We'll be using a Smart Tether to associate accurate position data with these readings. At that point we'll have a large collection of data points with associated sensor readings, and my task is to make these readings visible in a coherent and contextualized manner.
This is a project that I've actually already put a lot of work into – this past summer, I worked with Zoe to produce visualizations of data gathered on previous ICEX missions and other projects. One data set I focused on in particular was some oxygenation data sampled from Hopavagen Bay in Norway. I'll be including pictures from that data set in this post as examples of the sort of analysis I'll be doing with the data collected this year in Malta.
Starting with the initial data set, one of the simplest visualizations that can be done is simply drawing each individual point from the set. This is often called a point cloud or glyph view.
![]() |
| One small colored cube for each point in the data set. Here, red colors indicate high oxygenation and blue colors indicate low oxygenation. |
![]() |
| Volume render with point cloud context. |
![]() |
| Only areas of the data volume which have a certain sensor value are shown, making it easy to search for internal patterns within the data. |
![]() |
| Geographic context! |
So that's an overview of some of the previous work I've been doing on this project – in my next post I'll talk about some of the improvements I've been adding this quarter.
~Ian
Friday, February 1, 2013
Update on WebGL Data Visualization
Since
my last post, I have been working on adding lighting to my program
and fixing the incorrect texture coordinates. With the help of Ian, I
have finally been able to fix the texture coordinates! My next task is to make the Cistern more user friendly and add more features (such as quick "top view" and "side view" buttons).
Meeting
up with the Harvey Mudd students was especially exciting. I enjoyed
meeting everyone and being able to host one of the Harvey Mudd
students, Josh, at my house. Everyone was at my house on Saturday
night coding, working on the robots, and just getting to know each
other. I am glad we were able to meet everyone before we go to Malta, I just wish they could be there for the full 4 weeks! It
was very interesting to see what Ben and Allistair were doing with
the ROS software, and they assisted me in getting it set up on my
laptop so we can use the software while they are back at Harvey Mudd.
We had a very exciting (and busy!) weekend, and it was nice to hear
about everyone's different jobs for our project. I found Timmy
Gambin's talk about underwater archaeological sites very interesting. I have never met an archaeologist before and it was interesting to hear
all his stories about shipwrecks throughout the Mediterranean.
Being
a part of a program like this has been an amazing experience already.
I am looking forward to getting the most possible out of this program
in knowledge and cultural experience in Malta. Going abroad is not
something I initially thought was possible. As a previous Animal
Science major, and now a cuurent Computer Science major, I am already behind in
my classes. However, because of this program I am now able to not
only experience a new and exciting culture, but also have the
opportunity to meet and learn from other amazing people and
professors. Combining engineering classes and an abroad experience is
one of the best ideas I have ever heard of! We are now able to not
only grow by being in a new culture, but also expand our knowledge
and explore engineering interests that we didn't know we had
previously (like robotics). I am so excited to go to Malta and I am
thrilled to be able to go on this trip with all the ICEX members and
staff. Everyone on the team is so supportive, willing to help each
other out, invested in this program, and that really makes this
experience one of a kind!
Learning
about other cultures in our Global Engineering course has proven to
be quite useful and eye-opening. We just began doing readings and learning about
Sicily and Malta, and I am excited to start my personal research
project about the history of Malta. We haven't picked our subject matter
yet but I'm thinking of working with Amanda to create a teaching
module and possibly trying to incorporate my data visualization of
the cistern!
I
am looking forward to learning more about graphics, global
engineering, and robotics in the next 4 weeks, and then we will be
off to explore Malta and the cisterns in person!
-Vanessa
Meeting up in SLO
Last weekend we (Harvey Mudd ICEX) drove up to San Luis Obispo for a meet and greet with the rest of the team at Cal Poly. It was a long drive to get there, and as Joshua said, Cal Poly is huge, at least in comparison to Mudd, which is a tiny liberal arts technical school where the campus is laid out in one straight 800m strip. Talking to the Cal Poly students, I also learned about their engineering curriculum, which is pretty different from the general engineering degree offered at HMC.
On Sunday morning the Cal Poly students presented to us about their work - outreach programs and visualization/mapping of Maltese cistern data collected from previous years of ICEX. It was interesting learning more about the image mosaicking and stereovision techniques they are using and planning for the upcoming trip.
We also did some demos and deployments in a couple pools - testing that made us learn to be more prepared, and resourceful. Between some shared equipment, duct tape and zip ties, we managed to collect pool data with two sonars mounted on the ROV! And now we're looking at an independent system to collect valuable environmental data - temperature, pressure and salinity readings. After that busy weekend, there is still lots to do to prepare for this trip - until we meet again, in the Mediterranean!
On Sunday morning the Cal Poly students presented to us about their work - outreach programs and visualization/mapping of Maltese cistern data collected from previous years of ICEX. It was interesting learning more about the image mosaicking and stereovision techniques they are using and planning for the upcoming trip.
We also did some demos and deployments in a couple pools - testing that made us learn to be more prepared, and resourceful. Between some shared equipment, duct tape and zip ties, we managed to collect pool data with two sonars mounted on the ROV! And now we're looking at an independent system to collect valuable environmental data - temperature, pressure and salinity readings. After that busy weekend, there is still lots to do to prepare for this trip - until we meet again, in the Mediterranean!
Investigating Disparity Options
This
weekend the Cal Poly team hosted the Harvey Mudd team and Dr. Gambin
for 28 hours of testing, collaborating, and team building. We were able
to deploy the ROV in two different pools (as well as some sonar fun in a
bath tub). These tests gave us each an opportunity to fly, man the
tether, and write logs.
Flying in the pool
The
tests were also a great opportunity to make some mistakes. We
discovered several small things that we will need to find or purchase
before we leave. It was a great opportunity to make some mistakes, since
they can still be fixed before our departure date. We were also able to
agree upon several software features that we would like to add.
There
have been many changes to my stereo vision work. Last week, Erik
performed some initial tests with the disparity function built into
Matlab. His early tests look promising and in many cases had fewer
invalid regions than the Zitnick Kanade algorithm, which we had
previously been using. We plan to do a more complete test this coming
week. If these tests are successful, my project focus will likely shift
to some digital humanities work and/or point cloud generation based on
the stereo vision data.
![]() |
| Right Camera |
![]() |
| Matlab |
![]() |
| Zitnick Kanade |
I
am really excited about these new projects and I will be spending some
time this weekend investigating my options. More details to come…
-Spencer
Subscribe to:
Posts (Atom)